The Prometheus Blackbox Exporter is a flexible and powerful tool used to monitor endpoints over various protocols such as HTTP, HTTPS, TCP, and ICMP (ping). This guide will walk you through everything you need to know about setting up and configuring the Blackbox Exporter with Prometheus, including writing configurations, setting up Docker Compose, and using it to monitor your infrastructure.
What is the Blackbox Exporter?
The Blackbox Exporter is a Prometheus exporter that probes endpoints using different protocols and returns metrics about their availability and response times. It is called “blackbox” because it doesn’t care about the internals of the service but only about whether it responds as expected.
Prerequisites
- Docker and Docker Compose installed on your system.
- Basic knowledge of Prometheus and monitoring concepts.
- A target endpoint to monitor (e.g., websites, APIs, or TCP ports).
I assume you already have prometheus and blackbox exporter installed on your system.
Step 1: Setting Up the Project Directory
- Create a project directory to house all configuration files:
mkdir blackbox-exporter-setup cd blackbox-exporter-setup - Inside this directory, create a
configfolder to hold the configuration files:mkdir config
Step 2: Writing the Blackbox Exporter Configuration File
The Blackbox Exporter uses a configuration file (blackbox.yml) to define how endpoints are probed. Here is an example configuration:
config/blackbox.yml

modules:
  http_2xx:
    prober: http
    timeout: 5s
    http:
      method: GET
      fail_if_ssl: false
      fail_if_not_ssl: false
      valid_http_versions: ["HTTP/1.1", "HTTP/2"]
      valid_status_codes: []  # Defaults to 2xx
      follow_redirects: true
  tcp_connect:
    prober: tcp
    timeout: 5s
    tcp:
      ip_protocol_fallback: true
  icmp_ping:
    prober: icmp
    timeout: 5s
    icmp:
      preferred_ip_protocol: "ip4"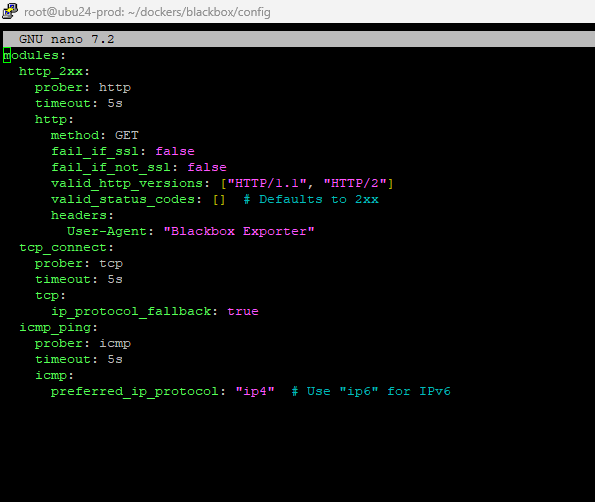
Explanation:
http_2xx:- Probes HTTP(S) endpoints.
- Checks if the response status code is in the
2xxrange (default).
tcp_connect:- Probes TCP endpoints to check if they are reachable.
icmp_ping:- Uses ICMP (ping) to check if a host is reachable.
Step 3: Writing the Docker Compose File
Use Docker Compose to manage the Blackbox Exporter and Prometheus containers.
docker-compose.yml
version: '3.8'
services:
  blackbox_exporter:
    image: quay.io/prometheus/blackbox-exporter:latest
    container_name: blackbox_exporter
    ports:
      - "9215:9115"  # Expose the Blackbox Exporter on port 9215
    volumes:
      - ./config:/config
    command:
      - "--config.file=/config/blackbox.yml"
    restart: unless-stopped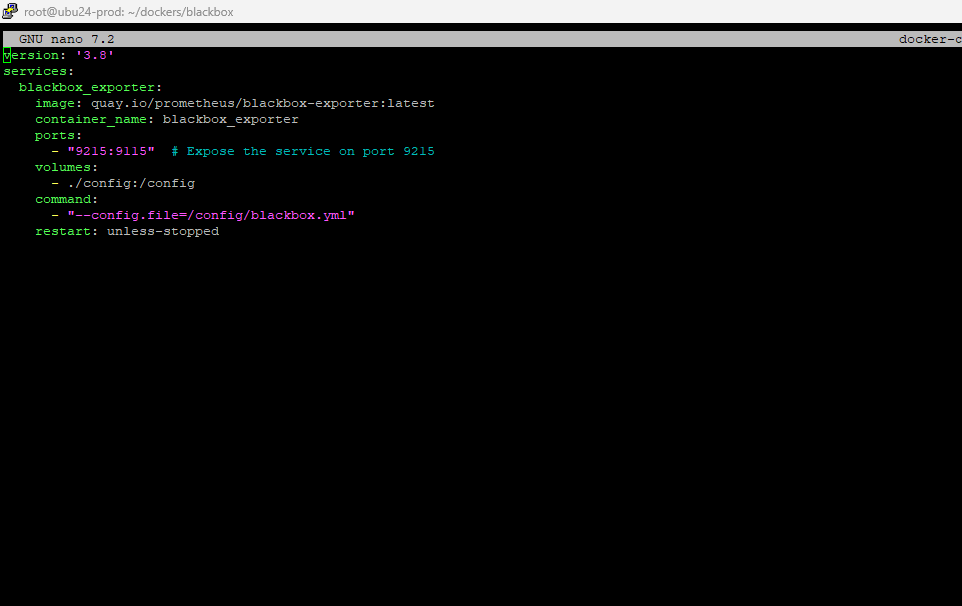
Step 4: Writing the Prometheus Configuration File
Prometheus requires a configuration file (prometheus.yml) to scrape metrics from the Blackbox Exporter.
config/prometheus.yml
global:
  scrape_interval: 15s  # Default scrape interval

scrape_configs:
  - job_name: 'blackbox'
    metrics_path: /probe
    params:
      module: [http_2xx]  # Use the module defined in blackbox.yml
    static_configs:
      - targets:
          - http://example.com  # Replace with your target URLs
          - https://example.org
    relabel_configs:
      - source_labels: [__address__]
        target_label: __param_target
      - source_labels: [__param_target]
        target_label: instance
      - target_label: __address__
        replacement: blackbox_exporter:9215  # Address of the Blackbox Exporter

  - job_name: 'prometheus'
    static_configs:
      - targets: ['localhost:9090']  # Monitor Prometheus itself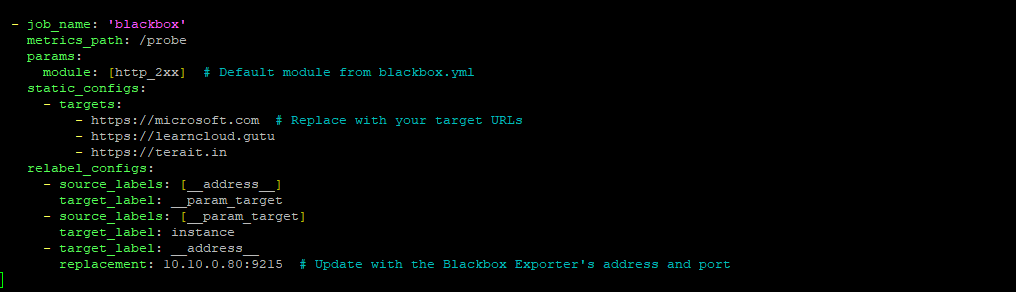
Explanation:
job_name: Identifies the scrape job.metrics_path: The Blackbox Exporter exposes metrics at/probe.params.module: Specifies the module to use (e.g.,http_2xx).static_configs.targets: The list of endpoints to monitor.relabel_configs: Dynamically rewrites target labels to use the Blackbox Exporter.
Step 5: Running the Setup
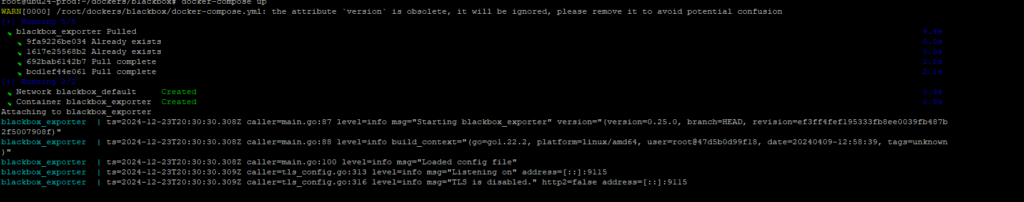
- Start the Docker containers:
docker-compose up -d - Verify that both services are running:
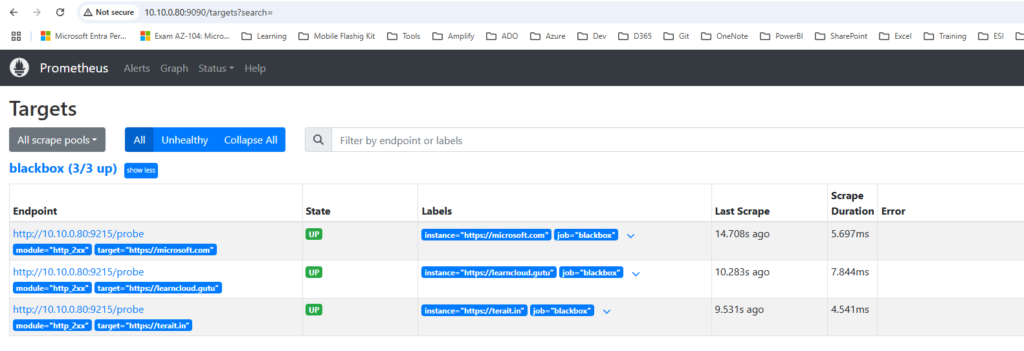
docker ps - Access Prometheus in your browser at:
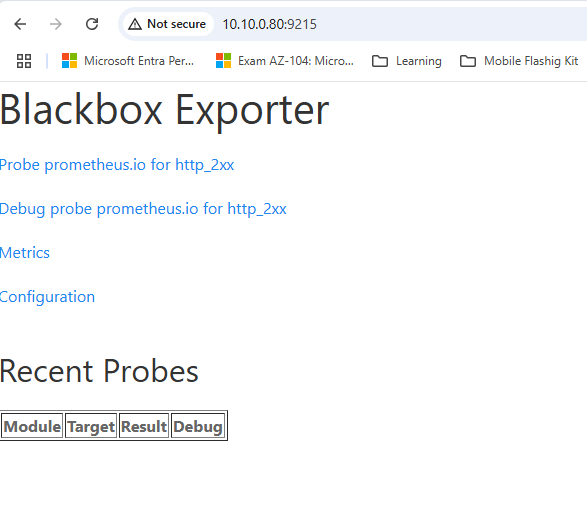
http://localhost:9090 - To test the Blackbox Exporter directly, access:
http://localhost:9215/probe?target=http://example.com&module=http_2xx
Step 6: Adding More Targets
To monitor additional endpoints, update the targets section in prometheus.yml and restart the Prometheus container:
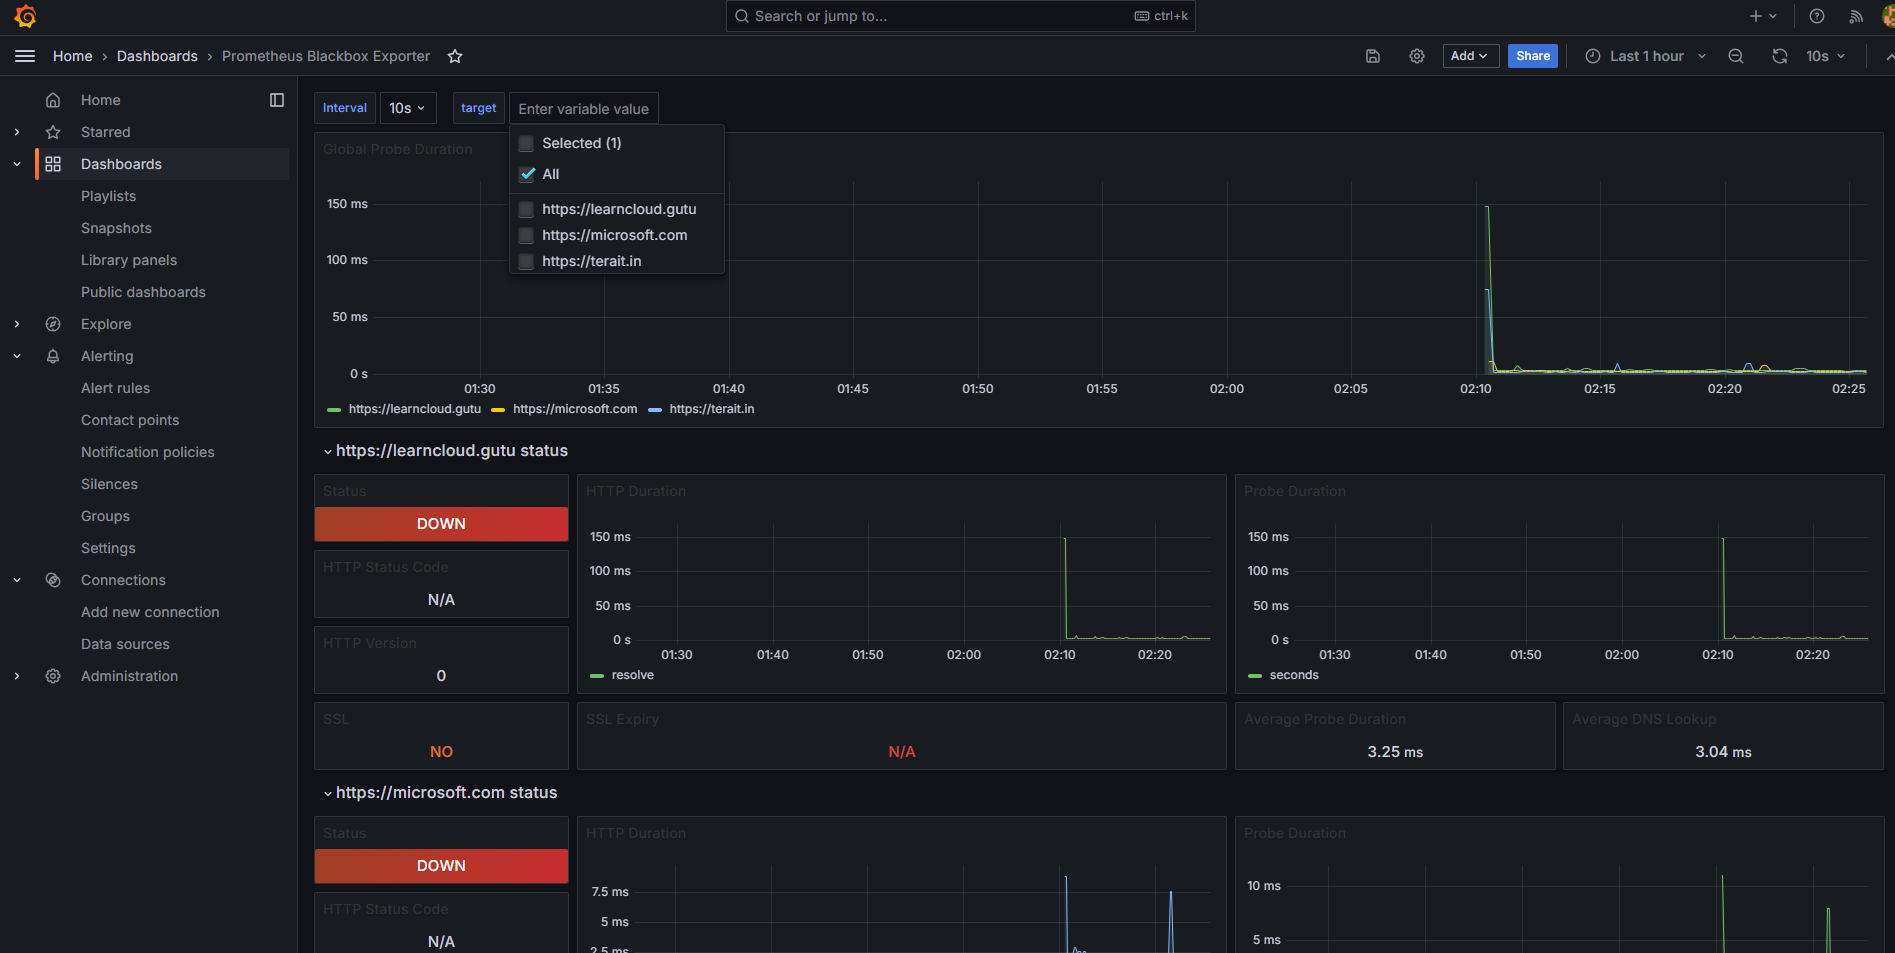
docker-compose restart prometheusStep 7: Visualizing Metrics
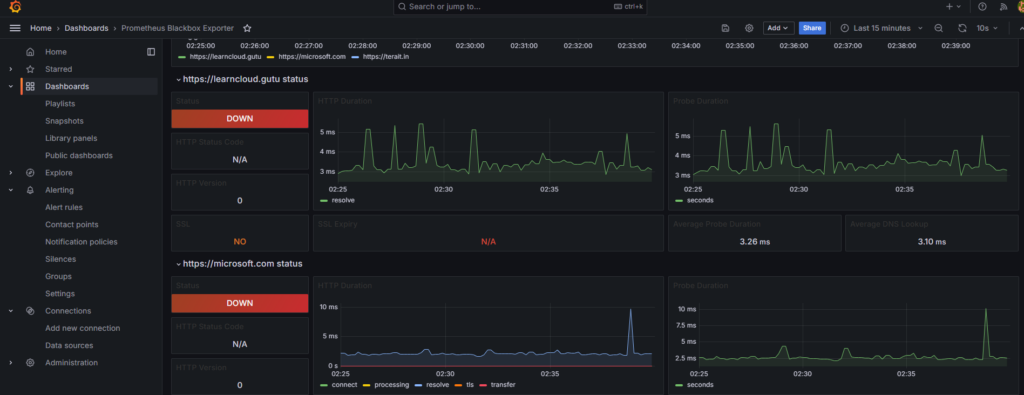
Use the Prometheus UI to query metrics exposed by the Blackbox Exporter. Common queries include:
- HTTP Probe Status:
probe_successThis returns1for successful probes and0for failed ones. - HTTP Probe Latency:
probe_http_duration_secondsThis shows the latency for HTTP probes. - TCP Probe Success:
probe_success{module="tcp_connect"}Displays the status of TCP probes.
Note: I have used Grafana Dashboard ID: 7587
Troubleshooting
- Blackbox Exporter Not Accessible:
- Check if the container is running:
docker logs blackbox_exporter - Ensure port
9215is mapped correctly.
- Check if the container is running:
- Prometheus Not Scraping Targets:
- Verify the Prometheus configuration:
docker logs prometheus - Test connectivity to the Blackbox Exporter.
- Verify the Prometheus configuration:
- Configuration Issues:
- Ensure YAML files have the correct indentation.
- Restart containers after updating configurations:
docker-compose restart
Conclusion
With this setup, you can efficiently monitor the availability and performance of various endpoints using the Blackbox Exporter and Prometheus. This guide provides a solid foundation, but you can expand on it by adding alerting (using Alertmanager) or visualizations (using Grafana). For larger setups, consider managing configurations with a CI/CD pipeline or configuration management tools.
Happy Monitoring!